The COVID-19 Pandemic of 2020-2022 (D): Economic Inequality


Encyclopedia: Capitalism, Inequality
The circumstances of the COVID-19 pandemic as outlined in part (A) of this case study prompted serious concerns that the impact of the crisis affected segments of U.S. society differently. Some scholars1 pointed to earlier pandemics and other crises, all of which had tended to reduce economic inequality—would the same be true for the COVID-19 pandemic? The COVID pandemic had highlighted the precarious condition of the lower- and moderate-income segments of American society. Moreover, it had threatened the welfare of the middle class on which the social and political stability of society depended. To a large extent, the massive fiscal spending by the Federal Government had forestalled the worst economic consequences for these segments. Nonetheless, the crisis renewed calls for programs of economic and social justice.
Less evident in the economic figures were other consequences. Workers in the “gig economy” were especially vulnerable to shifts in economic demand—and at the same time, the pandemic lockdown generated demand for new gig services such as food delivery. Supply chain stresses were difficult to summarize in statistical terms, though failures of the supply chains led to stockouts of important goods, thus impairing the recovery. Immigrants who depended on cross-border work found themselves shut out of livelihoods. And developed economies generally fared better than emerging economies during and after the crisis. However, the murder of George Floyd in May 2020, which advanced the Black Lives Matter movement, riveted the nation on issues of social and economic inequality.
Assignment
- Discern from Exhibit D1, Exhibit D2, and Exhibit D3 the extent to which the loss of employment, the mortality from COVID, and the administration of vaccines were equally distributed. “Precarity” in Exhibit D2 means insecurity related to jobs, income, or well-being.
- Did income inequality in the U.S. change from 2019 to 2021?
- Consider the Interdecile ratios in Exhibit D4. How did inequality vary from before to after the pandemic? Between which income levels are the trend movements largest? Conventionally, three ratios gauge the changing relative incomes in an economy:
- 90-10: is the ratio of the average income at the 90th percentile divided by the average income at the 10th percentile.
- 90-50: the average income at the 90th percentile divided by the average income at the 50th percentile.
- 50-10: is the average income at the 50th percentile divided by the average income at the 10th percentile.
- Estimate the U.S. pre-tax Gini Coefficient for 2019, 2020, and 2021 based on percentiles of the income distribution given in Exhibit D52 , as provided in the associated spreadsheet, “COVID2020 STUDENTv21.xlsx.” Exhibit D6 gives an overview of the Gini Coefficient calculation. How did the Gini Coefficient change over the years? What might explain the change?
- Consider the Interdecile ratios in Exhibit D4. How did inequality vary from before to after the pandemic? Between which income levels are the trend movements largest? Conventionally, three ratios gauge the changing relative incomes in an economy:
- Interpret. Are the conclusions of the Gini Coefficient and the Interdecile Ratios consistent? As of 2021, has the COVID-19 pandemic resulted in a decline in income inequality as hypothesized by studies of earlier pandemics?
Exhibits
Exhibit D1
| % of Population | % COVID Cases | % COVID Deaths | Ratio % Deaths to % Population | |
|---|---|---|---|---|
| By Age Group | ||||
| Years 0-17 | 22.3% | 17.6% | 0.1% | 0.0 |
| 18-29 | 16.4% | 21.3% | 0.7% | 0.0 |
| 30-39 | 13.5% | 16.9% | 1.8% | 0.1 |
| 40-49 | 12.3% | 14.3% | 4.1% | 0.3 |
| 50-64 | 19.2% | 18.3% | 18.1% | 0.9 |
| 65-74 | 9.6% | 6.7% | 22.6% | 2.4 |
| 75-84 | 4.9% | 3.3% | 26.0% | 5.3 |
| 85+ | 2.0% | 1.6% | 26.5% | 13.3 |
| By Gender | ||||
| Male | 49.3% | 46.3% | 55.2% | 1.1 |
| Female | 50.8% | 53.1% | 44.8% | 0.9 |
| By Race/Ethnicity | ||||
| Hispanic/Latino | 18.5% | 24.9% | 17.2% | 0.9 |
| Native American | 0.7% | 1.1% | 1.1% | 1.5 |
| Asian | 5.8% | 3.8% | 3.3% | 0.6 |
| Black | 12.5% | 12.3% | 13.5% | 1.1 |
| White | 60.1% | 53.6% | 62.4% | 1.0 |
| Other | 2.9% | 5.1% | 2.5% | 0.9 |
Source: Author’s table based on data from U.S. Center for Disease Control, downloaded April 13, 2022 from https://covid.cdc.gov/covid-data-tracker/#demographics
Exhibit D2
| Lacking Sufficient Food During Pandemic | Not Current on Rent, October 2021 | Trouble Paying for Usual Household Expenses Last 7 Days October 2021 | Peak Unemployment Rate during Pandemic | |
|---|---|---|---|---|
| All | 9% | 15% | 29% | 14.8% |
| Black, not Latino | 17% | 28% | 44% | 16.6% |
| Latino (any) | 16% | 18% | 38% | 18.2% |
| Other Multiracial (not Latino) | 19% | 18% | 42% | N/A |
| White | 6% | 12% | 23% | 12.8% |
| Asian | 5% | 20% | 21% | 13.7% |
Exhibit D3
| 2019 to 2020 | 2020 to 2021 | |
|---|---|---|
| All Households | -2.90%* | -0.60% |
| Family Households | -3.20%* | 0.50% |
| Nonfamily Households | -3.10%* | -1.90%* |
| Female Householder | 1.50% | -4.70%* |
| Male Householder | -3.80%* | -0.30% |
| Race | ||
| White | -2.60%* | -1.00% |
| Black | -0.30% | 0.30% |
| Asian | -4.50%* | 1.80% |
| Hispanic | -2.60%* | -0.10% |
| Age | ||
| Under 65 years | -2.60%* | 0.30% |
| 65 years or older | -3.30%* | -2.60%* |
| Nativity | ||
| Native-born | -2.20%* | -1.40%* |
| Foreign-born | -5.70%* | 1.50% |
| Region | ||
| Northeast | -2.50% | -2.00% |
| Midwest | -3.20%* | 0.90% |
| South | -2.30%* | -1.50% |
| West | -2.30%* | 0.90% |
| Residence | ||
| Major Metro | -2.60%* | -1.10% |
| Outside Metro | -2.10% | -1.00% |
| Educational Attainment | ||
| No High School | -5.70%* | -2.40% |
| High School | -3.90%* | 0.90% |
| Some College | -2.80%* | -4.00%* |
| Bachelor's Degree or Higher | -2.80%* | 2.70%* |
Note: Asterisk indicates the difference is significant at the 90 percent confidence level or higher.
Source: Author’s table based on data in Emily A. Shrider et al, 2021. “Income and Poverty in the United States: 2020,” Current Population Reports, U.S. Census Bureau, Department of Commerce, Washington, D.C., and Jessica Semega and Melissa Kollar, 2022. “Income in the United States: 2021,” Current Population Reports, U.S. Census Bureau, Department of Commerce, Washington D.C.
Exhibit D4
| 10th percentile | 50th (median) | 90th percentile | 90th/10th | 90th/50th | 50th/10th | |
|---|---|---|---|---|---|---|
| Household income at selected percentiles | Household income at selected percentiles | Household income at selected percentiles | Interdecile ratios at selected percentiles | Interdecile ratios at selected percentiles | Interdecile ratios at selected percentiles | |
| 2021 | 15,660 | 70,784 | 211,956 | 13.53 | 2.99 | 4.52 |
| 2020 | 16,386 | 71,186 | 211,438 | 12.90 | 2.97 | 4.34 |
| 2019 | 16,984 | 72,808 | 213,171 | 12.55 | 2.93 | 4.29 |
| 2018 | 15,784 | 68,168 | 198,844 | 12.60 | 2.92 | 4.32 |
| 2017 | 15,809 | 67,571 | 200,892 | 12.71 | 2.97 | 4.27 |
| 2017 | 15,716 | 67,832 | 197,927 | 12.59 | 2.92 | 4.32 |
| 2016 | 15,364 | 66,657 | 192,541 | 12.53 | 2.89 | 4.34 |
| 2015 | 15,163 | 64,631 | 185,468 | 12.23 | 2.87 | 4.26 |
| 2014 | 14,063 | 61,468 | 180,402 | 12.83 | 2.93 | 4.37 |
| 2013 | 14,211 | 62,425 | 181,066 | 12.74 | 2.90 | 4.39 |
| 2013 | 14,447 | 60,507 | 174,745 | 12.10 | 2.89 | 4.19 |
| 2012 | 14,466 | 172,604 | 172,604 | 11.93 | 2.86 | 4.17 |
| 2011 | 14,487 | 60,428 | 173,376 | 11.97 | 2.87 | 4.17 |
| 2010 | 14,771 | 61,364 | 172,822 | 11.70 | 2.82 | 4.15 |
| 2009 | 15,342 | 63,011 | 174,223 | 11.36 | 2.76 | 4.11 |
| 2008 | 15,341 | 63,455 | 174,460 | 11.37 | 2.75 | 4.14 |
| 2007 | 15,931 | 65,801 | 178,148 | 11.18 | 2.71 | 4.13 |
| 2006 | 16,165 | 64,930 | 179,159 | 11.08 | 2.76 | 4.02 |
| 2005 | 15,699 | 64,427 | 175,357 | 11.17 | 2.72 | 4.10 |
| 2004 | 15,681 | 63,745 | 173,786 | 11.08 | 2.73 | 4.07 |
| 2003 | 15,558 | 63,967 | 174,544 | 11.22 | 2.73 | 4.11 |
| 2002 | 16,039 | 64,047 | 172,334 | 10.75 | 2.69 | 3.95 |
| 2001 | 16,393 | 64,779 | 174,308 | 10.63 | 2.69 | 3.95 |
| 2000 | 16,695 | 66,248 | 176,702 | 10.58 | 2.67 | 3.97 |
| 1990 | 14,758 | 60,370 | 149,398 | 10.12 | 2.47 | 4.09 |
| 1980 | 14,127 | 55,596 | 128,405 | 9.09 | 2.31 | 3.94 |
| 1970 | 12,651 | 54,536 | 116,609 | 9.22 | 2.13 | 4.32 |
Note: Inflation-adjusted estimates may differ slightly from other published data due to rounding. Margins of error are available via email at sehsd.isb.list@census.gov.
Source: U.S. Census Bureau, Current Population Survey, 1968 to 2022 Annual Social and Economic Supplements (CPS ASEC).
Exhibit D5
| Household Income Percentage | 2021 (Reported in 2022) | 2020 (Reported in 2021) | 2019 (Reported in 2020) | Absolute Increase 2020 vs. 2019 | Percentage Change 2020 vs. 2019 | Absolute Increase 2021 vs. 2010 | Percentage Change 2021 vs. 2010 | 2019 Percent of Household Income | 2019 Cumulative Percent of Household Income | 2019 Area Under Lorenz Curve(Note 1) | 2020 Percent of Household Income | 2020 Cumulative Percent of Household Income | 2020 Area Under Lorenz Curve(Note 1) | 2021 Percent of Household Income | 2021 Cumulative Percent of Household Income | 2021 Area Under Lorenz Curve(Note 1) |
|---|---|---|---|---|---|---|---|---|---|---|---|---|---|---|---|---|
| 0% | 0 | 0 | 0 | 0 | 0 | 0 | 0 | 0 | 0 | 0.000% | 0 | 0 | 0.000% | 0 | 0 | 0.000% |
| 1% | $0 | $0 | $0 | $0 | 0.00% | $0 | $0 | 0 | 0 | 0.000% | 0 | 0 | 0.000% | $0 | 0 | 0.000% |
| 2% | $700 | $800 | $1,400 | ($600) | -75.00% | ($100) | -12.50% | 0.02% | 0.002% | 0.000% | 0.02% | 0.02% | 0.000% | 0.01% | 0.01% | 0.000% |
| 3% | $3,943 | $4,165 | $5,000 | ($835) | -20.05% | ($222) | -5.33% | 0.05% | 0.007% | 0.000% | 0.05% | 0.07% | 0.000% | 0.04% | 0.05% | 0.003% |
| 4% | $7,182 | $7,200 | $8,174 | ($974) | -13.53% | ($18) | -0.25% | 0.09% | 0.16% | 0.001% | 0.09% | 0.16% | 0.001% | 0.07% | 0.12% | 0.006% |
| 5% | $9,474 | $9,372 | $9,860 | ($488) | -5.21% | $102 | 1.09% | 0.11% | 0.26% | 0.002% | 0.11% | 0.26% | 0.002% | 0.10% | 0.22% | 0.017% |
| 6% | $10,736 | $10,735 | $11,130 | ($395) | -3.68% | $1 | 0.01% | 0.12% | 0.38% | 0.003% | 0.12% | 0.38% | 0.003% | 0.11% | 0.33% | 0.027% |
| 7% | $12,000 | $12,000 | $12,210 | ($210) | -1.75% | $0 | 0.00% | 0.13% | 0.51% | 0.004% | 0.13% | 0.51% | 0.004% | 0.12% | 0.45% | 0.039% |
| 8% | $13,232 | $13,200 | $13,596 | $(396) | -3.00% | $32 | 0.24% | 0.15% | 0.66% | 0.006% | 0.15% | 0.66% | 0.006% | 0.14% | 0.59% | 0.052% |
| 9% | $14,500 | $14,401 | $14,843 | ($442) | -3.07% | $99 | 0.69% | 0.16% | 0.82% | 0.007% | 0.16% | 0.82% | 0.007% | 0.15% | 0.74% | 0.066% |
| 10% | $15,640 | $15,600 | $16,020 | ($420) | -2.69% | $40 | 0.26% | 0.17% | 0.99% | 0.009% | 0.17% | 0.99% | 0.009% | 0.16% | 0.90% | 0.082% |
| 11% | $16,908 | $16,776 | $17,226 | ($450) | -2.68 | $132 | 0.79% | 0.18% | 1.17% | 0.011% | 0.18% | 1.18% | 0.011% | 0.17% | 1.07% | 0.099% |
| 12% | $18,166 | $18,000 | $18,427 | ($427) | -2.37% | $166 | 0.92% | 0.20% | 1.37% | 0.013% | 0.20% | 1.37% | 0.013% | 0.19% | 1.26% | 0.0117% |
| 13% | $19,510 | $19,010 | $19,745 | ($735) | -3.87% | $500 | 2.63% | 0.21% | 1.58% | 0.015% | 0.21% | 1.59% | 0.015% | 0.20% | 1.46% | 0.0136% |
| 14% | $20,400 | $20,000 | $20,826 | ($826) | -4.13% | $400 | 2.00% | 0.22% | 1.81% | 0.017% | 0.22% | 1.81% | 0.017% | 0.21% | 1.67% | 0.0157% |
| 15% | $21,736 | $21,035 | $22,066 | ($1,031) | -4.90% | $701 | 3.33% | 0.24% | 2.04% | 0.019% | 0.24% | 2.05% | 0.019% | 0.22% | 1.89% | 0.0178% |
| 16% | $23,002 | $22,300 | $23,502 | ($1,202) | -5.39% | $702 | 3.15% | 0.25% | 2.30% | 0.022% | 0.25% | 2.30% | 0.022% | 0.24% | 2.13% | 0.0201% |
| 17% | $24,240 | $23,600 | $24,872 | ($1,272) | -5.39% | $640 | 2.71% | 0.27% | 2.56% | 0.024% | 0.27% | 2.57% | 0.024% | 0.25% | 2.38% | 0.0226% |
| 18% | $25,200 | $24,800 | $25,668 | ($868) | -3.50% | $400 | 1.61% | 0.28% | 2.84% | 0.027% | 0.28% | 2.84% | 0.027% | 0.26% | 2.64% | 0.0251% |
| 19% | $26,613 | $25,750 | $26,926 | ($1,176) | -4.57% | $863 | 3.35% | 0.29% | 2.13% | 0.030% | 0.29% | 3.13% | 0.030% | 0.27% | 2.91% | 0.0278% |
| 20% | $28,002 | $27,012 | $28,035 | ($1,023) | -3.79% | $990 | 3.67% | 0.30% | 3.43% | 0.033% | 0.30% | 3.43% | 0.30% | 0.29% | 3.20 | 0.0306% |
Source: Author’s table derived from data at DQYDJ, downloaded on November 5, 2022 from https://dqydj.com/2021-average-median-top-household-income-percentiles/. These data are drawn from “HINC-06. Income Distribution to $250,000 or More for Households,” 2019 and 2021, Current Population Survey, Annual Social and Economic Supplement, U.S. Census Bureau, Department of Commerce, Washington, D.C., downloaded November 2, 2022 from https://www.census.gov/data/tables/time-series/demo/income-poverty/cps-hinc/hinc-06.html.
Exhibit D6
Measuring the Gini Coefficient
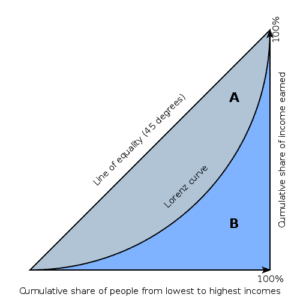
The Gini Coefficient is a measure of the income inequality among segments of the population.3 It can range between values of zero and one, where zero indicates absolute inequality, and one indicates perfect equality. In graphic terms, a ranking of the cumulative share of income on the vertical axis by a ranking of the cumulative share of people by their income (from lowest to highest) is depicted in the following figure. Perfect equality is depicted by the 45-degree line. Most societies, however, have some income inequality, which yields deviation below perfect equality. This deviation is depicted by the “Lorenz Curve,” a plot of cumulative share of income against cumulative share of people. The Gini Coefficient is the ratio of area A divided by the sum of areas A and B.
(1) Gini=A/(A+B)
To find the Gini Coefficient, analysts typically estimate the area B, which allows them to estimate area A and compute the ratio since A + B = 0.5. Thus, the Gini Coefficient can also be estimated as
(2) Gini=1-2B
The task, therefore, is to estimate the size of area B, under the Lorenz curve. A rough approximation in Excel, would be to sum the rectangles for each percentile under the Lorenz curve. A closer approximation in Excel would be to sum the trapezoids for each percentile under the Lorenz curve. Exhibit D5 already computes the size of the trapezoids at each percentile. The task remaining for the analyst is to sum the areas of the trapezoids to gain an estimate of the size of area B, and then to complete the calculation using Equation (2)
Notes
1 See, for instance, Walter Scheidel of Stanford: Walter Scheidel, “Why the Wealthy Fear Pandemics: The Coronavirus, like other plagues before it, could shift the balance between rich and poor,” New York Times, April 9, 2020, downloaded November 4, 2022 from https://www.nytimes.com/2020/04/09/opinion/sunday/coronavirus-economy-history.html.
2 Tutorials on the Gini Coefficient may be found online. See, for instance, the briefing at Khan Academy: https://www.khanacademy.org/economics-finance-domain/ap-microeconomics/ap-consumer-producer-surplus/inequality/v/gini-coefficient-and-lorenz-curve. Also, several Gini Coefficient calculators are publicly available online.
3 The Gini Coefficient also has applications in other fields, such as measuring the inequality among market shares of firms competing in the same industry—this is useful for purposes of antitrust analysis.